
Vegetation Zones of Taiwan — Information Design


This infographic was requested by Lu Hsin, a landscape architect, during her final master’s thesis on an ethnobotanical garden in Taiwan at AHO – The Oslo School of Architecture and Design.
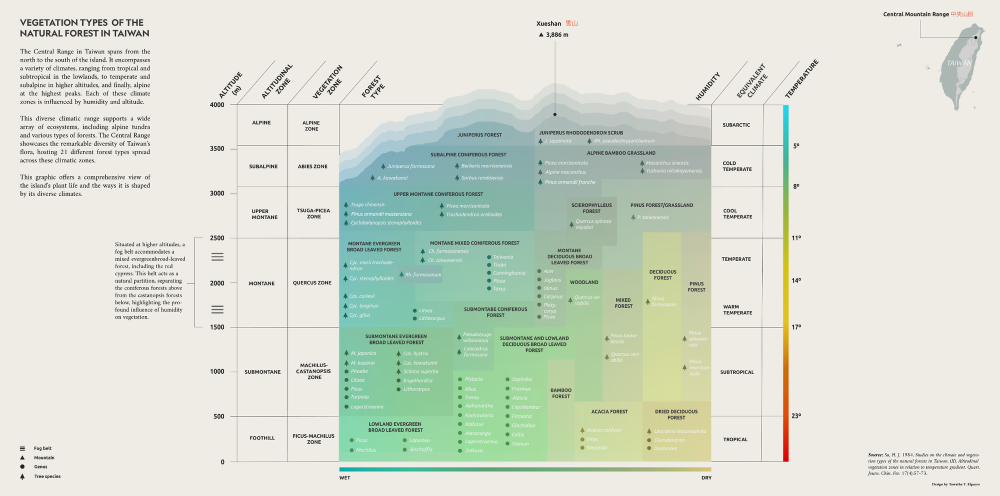
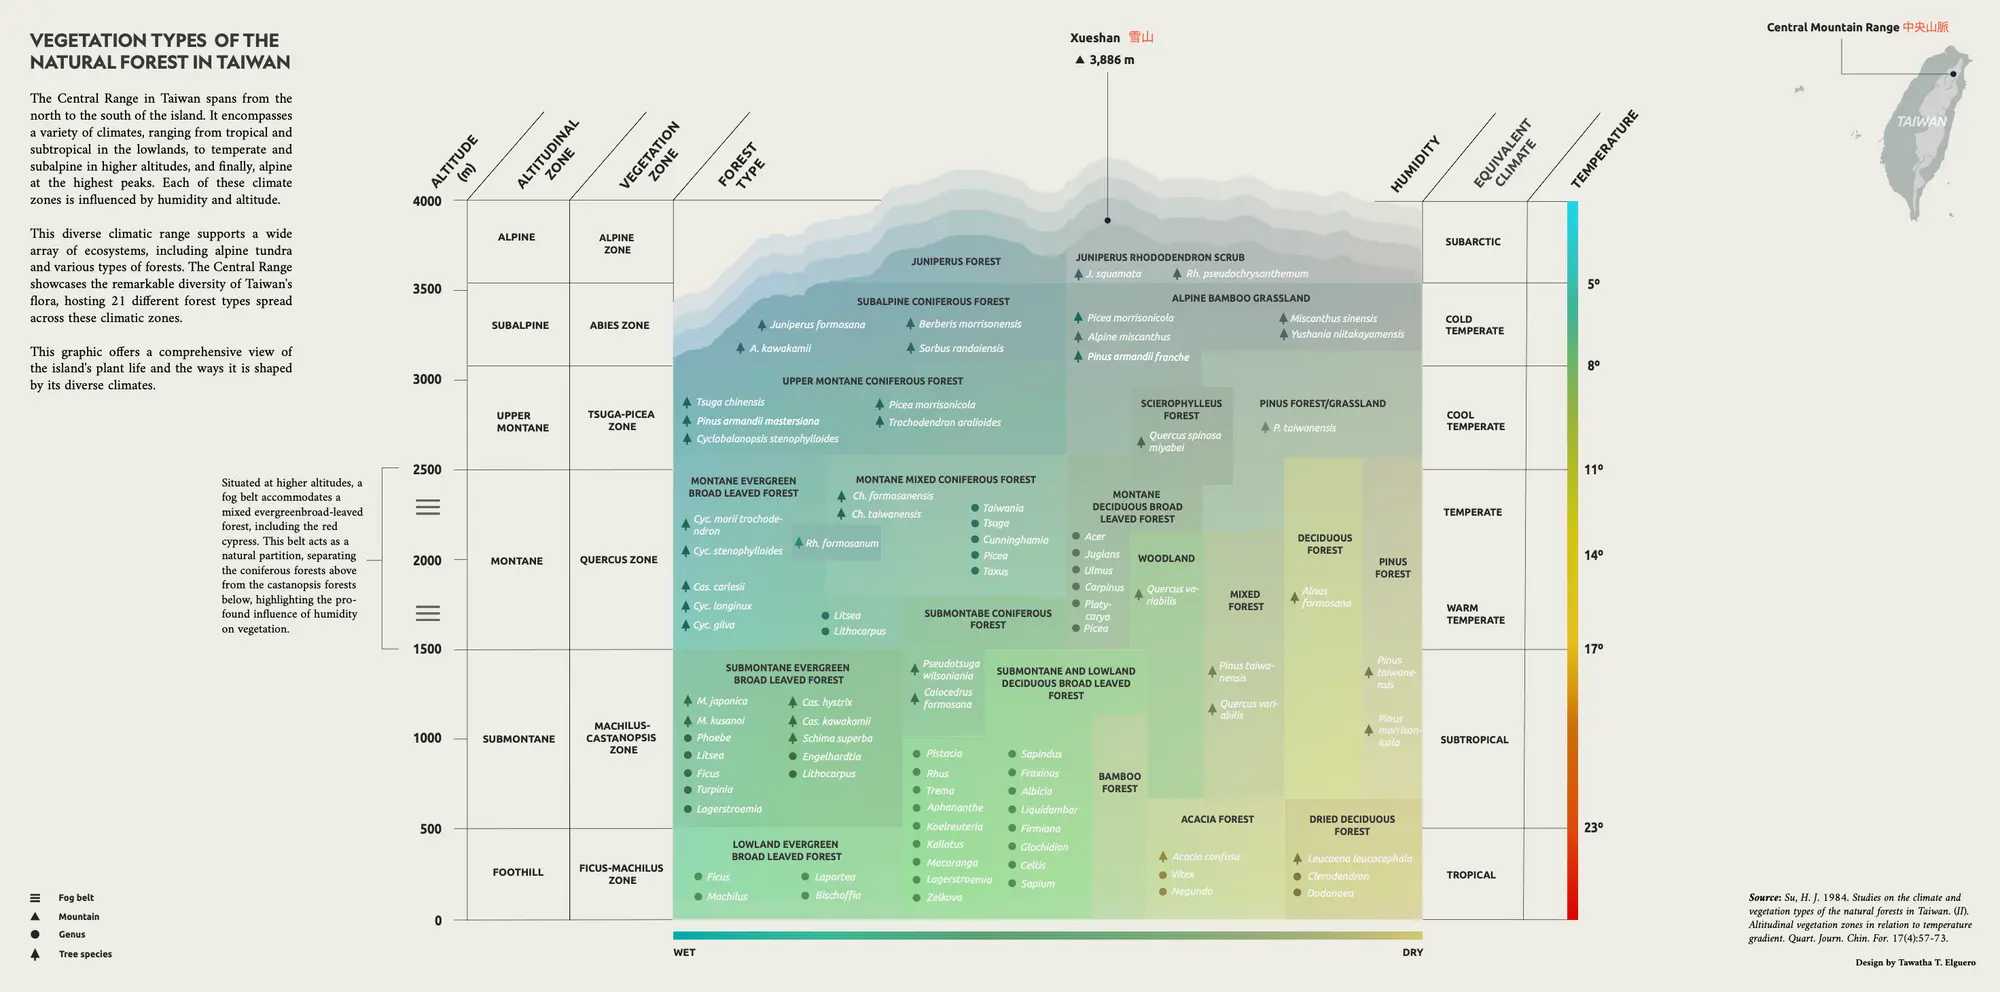
It shows the vegetation zones of Taiwan’s natural forests along gradients of altitude, temperature, and humidity. It explains how Taiwan’s forests change from lowland tropical and subtropical forests near sea level, through montane evergreen and conifer forests, and up to the subalpine and alpine vegetation found near the island’s highest peaks, such as Xueshan, 3,886 m.
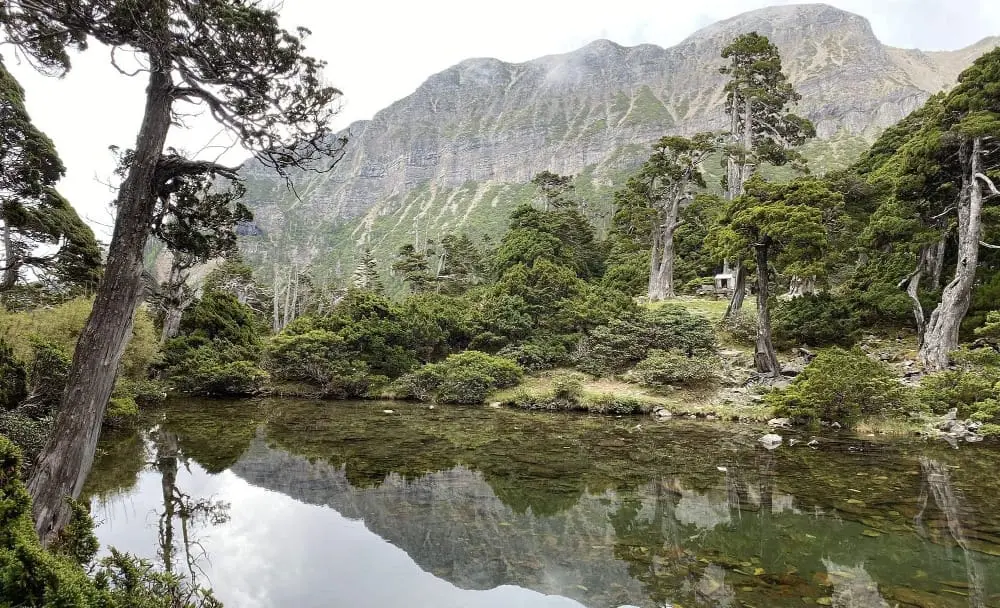
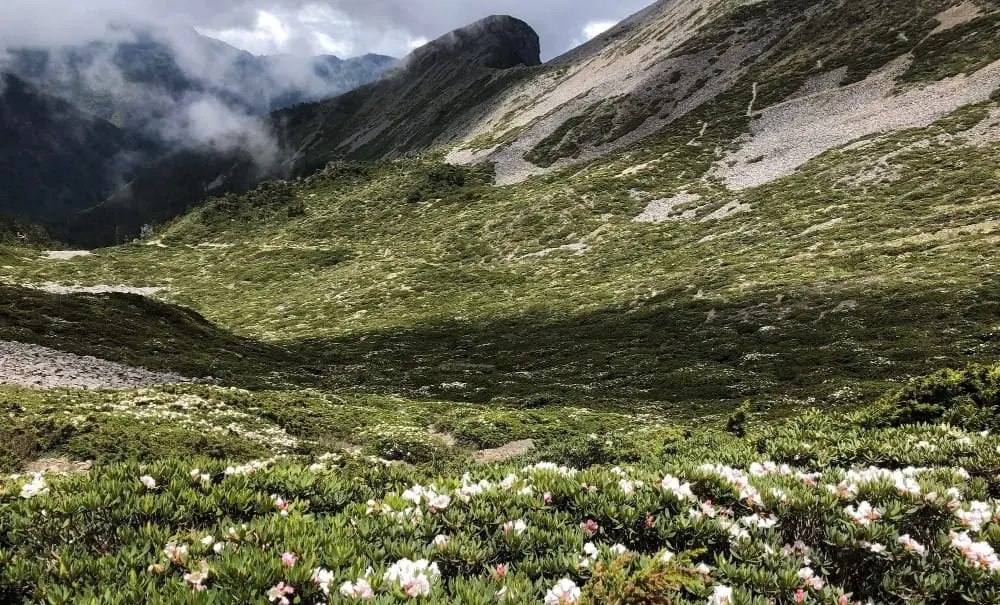
Some captions from the location on-site:
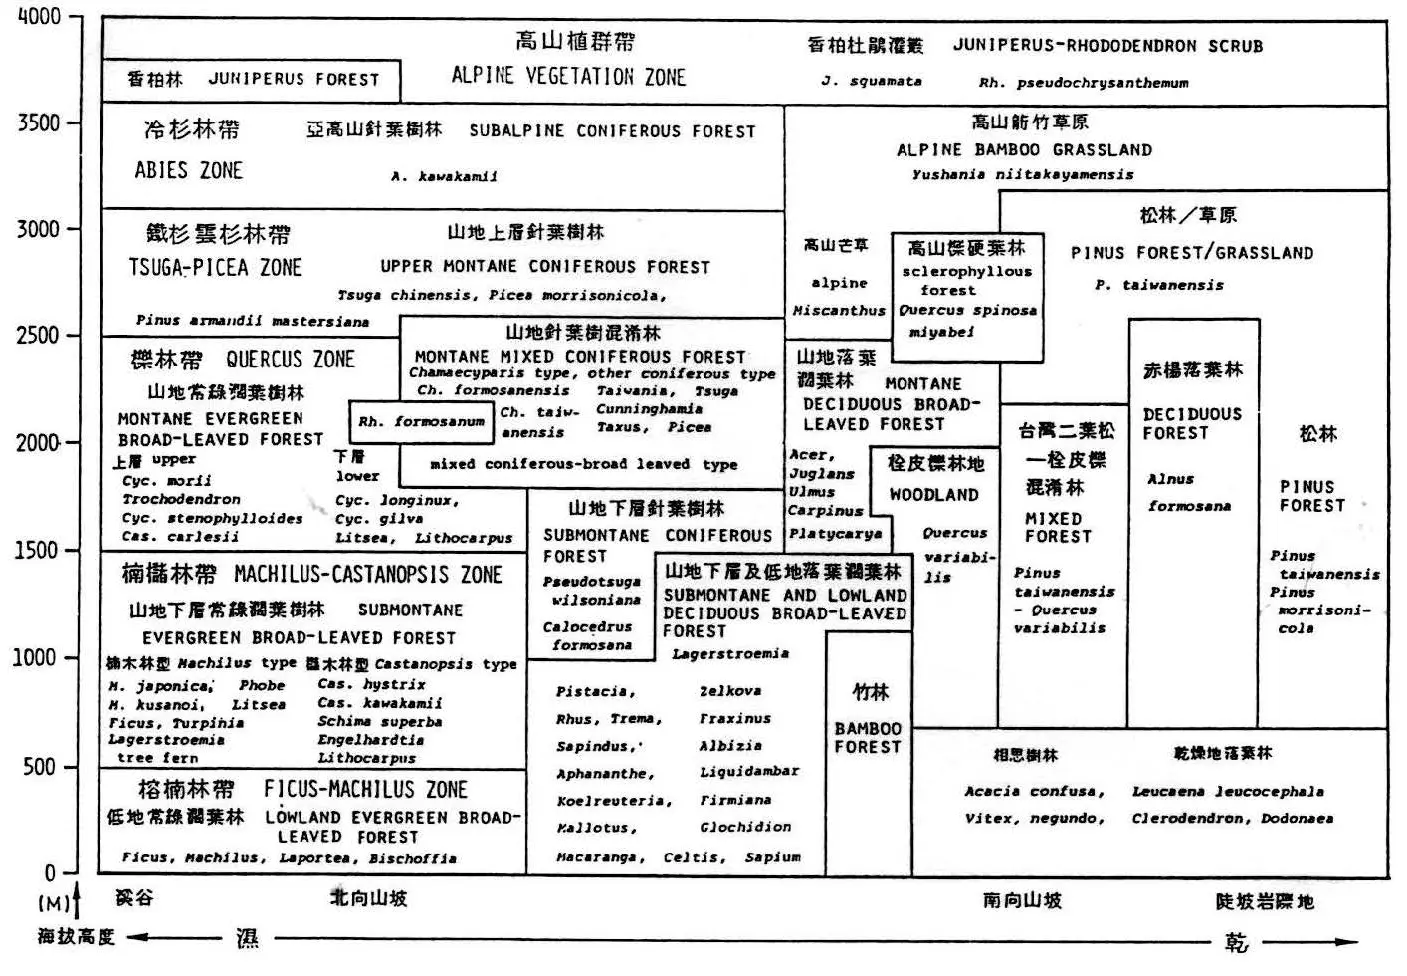
The original reference I was given was an older scientific vegetation chart of Taiwan. It showed that, as one moves higher into Taiwan’s mountains, the plant communities shift from warm, wet forests to cold, high-mountain vegetation. It also showed that wet and dry slopes can support different types of forest even at the same altitude.
I then thought of using a bioclimatic classification chart as a second reference. It connects temperature and moisture to the kinds of ecosystems that can occur in a place, from desert and scrub to forest, rainforest, and tundra. The chart helped me understand vegetation through climate gradients: dry to wet, warm to cold, and the balance between rainfall and evaporation.
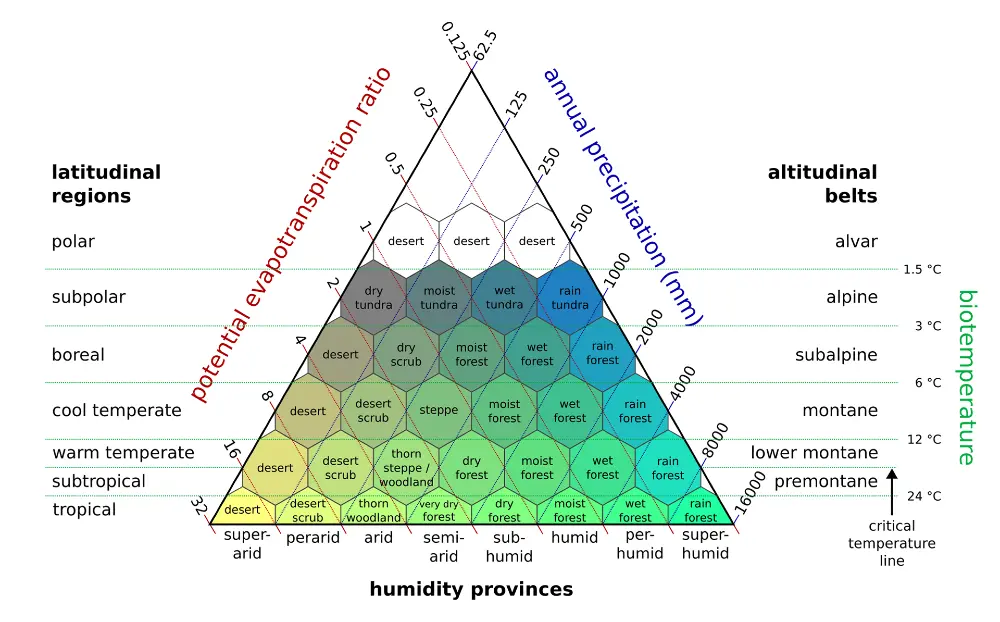
This kind of diagram is a useful global reference for understanding how climate shapes the living world, though it is not an absolute model. Real ecosystems are always more complex.
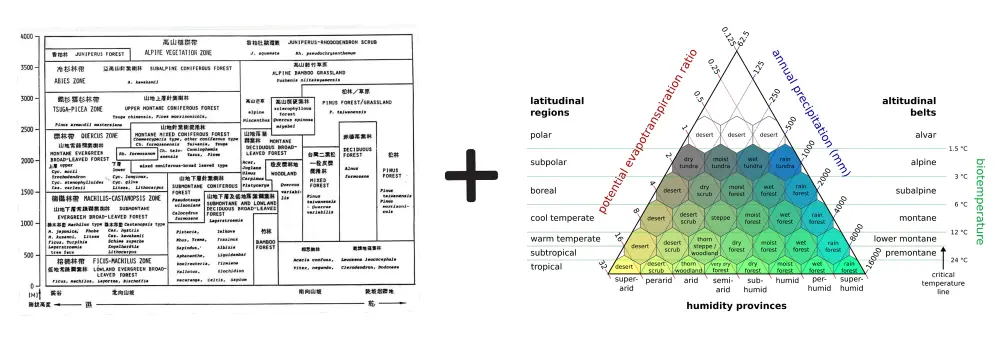
The old Taiwan vegetation chart gave me the local scientific information: the real forest zones of Taiwan, their altitude ranges, humidity differences, and characteristic species. The bioclimatic triangle gave me the visual and conceptual structure: a way to show vegetation as the result of climate gradients — warmer to colder, wetter to drier, and lowland to alpine.
I used this idea to make the final graph feel more like an ecological landscape.
Final result:
This graph was reviewed by Taiwanese naturalist and plant biologist Chih-Chieh Yu (游旨价) in 2023.
No spam, no sharing to third party. Only you and me.


Member discussion